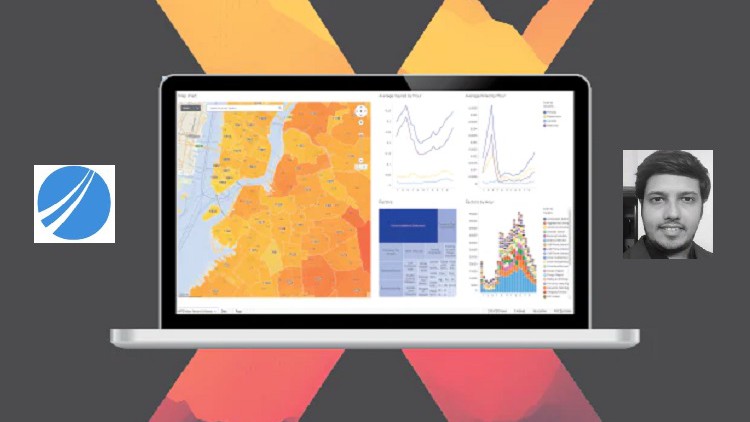
Learn TIBCO Spotfire in this Fast Paced Course – Covering all Topics like Charts, Mods, Python, R, Spotfire Cloud & more
What you will learn
Know about TIBCO Spotfire as an Enterprise Level BI tool
How to use TIBCO Spotfire to create Interactive and Beautiful Dashboards
How to connect to various Data Sources with Live Examples
Creating Data Models – Relationships, Unions, Joins, Column Matches
All the Chart Types in TIBCO Spotfire like Cross Table, Bar, Line, Geo Maps, Heat Maps, Scatter Plots, Summary Table etc and how to configure each of them
Add Property Controls like Dropdowns, Sliders and other Filter controls in your report to add user interactivity
Learn how to use Document Property to make your Dashboard powerful
Writing Advanced Custom Expressions
Advanced Topics like Python & R Scripts, using HTML in Text Areas
Using Developer Tools for real Production Scenarios
Best Chart Practices to create useful, interactive, feature-rich and beautiful Reports.
Guide to create Corporate Level Dashboards
Complete Dashboard Development Lifecycle
Useful references to quickly write complex Python Scripts
Creating Advanced Visualization Mods using VS Code
Important Topics like Data on Demand, Binning, Relationships, Subsets etc.
Using Spotfire Cloud to add Data Tables & create Visualizations.
Description
This TIBCO Spotfire course will help you to become a Data Visualization Expert and will enhance your BI skills by offering you comprehensive knowledge, and the required hands-on experience on this widely used BI tool, by solving real-time industry-based projects.
Topics Covered : Adding & Managing Data, Using Data Canvas, Creating & Configuring all Chart Types, Data Limit, Data on Demand, Details on Demand, Advanced Custom Expressions, Subsets, Hierarchy, Marking, Filtering, Action Control, Document Properties, Iron Python Scripting, R Scripts, Collaboration, Visualization Mods, Spotfire Cloud and a lot more !
Top Reasons why you should learn Tibco Spotfire :
- TIBCO Spotfire is among the top Business Intelligence tools used industry wide.
- The demand for BI professionals is on the rise. This is one of the most sought-after profession currently in the lines of Data Science, and the Salary is also among the highest in the industry.
- There are multiple opportunities across the Globe for everyone with the knowledge of Spotfire.
- Spotfire has a small learning curve and you can pick up even advanced concepts very quickly.
- Lot of Organizations are switching to Spotfire due to its advanced capabilities, and currently there is a shortage of Skilled Spotfire professionals.
Top Reasons why you should choose this Course :
- This course is designed keeping in mind the students from all backgrounds – hence we cover everything from basics, and gradually progress towards advanced topics.
- This course is fast paced and can be completed in a day.
- Actual Case Studies and Live Examples of all topics.
- All Doubts will be answered.
Most Importantly, Guidance is offered beyond the Tool – You will not only learn the Software, but important Dashboard Design principles. Also, I will share a cheat sheet to quickly find the right chart to use, sources to get public datasets to work on, Getting inspirational ideas, Best Resources to get Working Scripts, & Answers to all your doubts – Technical or Non-Technical.
This course is recommended for everyone who want to switch their career to Business Intelligence – the most lucrative job profile of 2022 and ahead.
A Verifiable Certificate of Completion is presented to all students who undertake this TIBCO Spotfire course.
Note : New Lectures on Advanced Topics, Useful Python Scripts & Helpful Tips will be added Regularly and Announcements will be made.
Content
Introduction
Adding & Managing Datasets
Creating and Configuring Various Chart Types
Managing Data in Visualizations
Action Controls and Dynamic Items
Property Controls and Document Properties
Iron Python & R
Closing Notes
As a seasoned professional navigating the ever-evolving landscape of business intelligence, I’ve had my share of encounters with various analytics platforms. TIBCO Spotfire, while perhaps not as ubiquitous as some of its competitors in every casual conversation, remains a formidable and deeply capable player in the enterprise space. This course, 'TIBCO Spotfire Development : Beginners To Advanced Course', promises a comprehensive journey, and I’m here to give you the unvarnished truth on whether it delivers on that hefty promise.
Overview
This isn't just another click-through tutorial; it’s a robust immersion into Spotfire, taking you from zero to hero. What genuinely impressed me was the course's commitment to showcasing Spotfire as a genuine enterprise-level BI tool. It goes beyond merely demonstrating features, delving into the practicalities of building robust, interactive dashboards that drive real business decisions. The "fast-paced" descriptor is apt – it doesn't waste time, but moves efficiently through complex topics, making sure to hit critical points like sophisticated data modeling techniques, diverse chart configurations, and crucial user interactivity elements. More significantly, its inclusion of advanced functionalities like Python/R scripting, and especially the relatively newer Spotfire Mods, ensures that learners are not just proficient, but truly skilled in customizing and extending Spotfire's capabilities. This holistic approach prepares you for real-world projects, not just academic exercises.
Prerequisites
While the course states "Beginners to Advanced," I’d advise having a foundational understanding of data concepts. You don’t need to be a SQL guru, but a basic grasp of what a table is, how data relates, and the general idea of data aggregation will make your journey smoother. If you’ve dabbled in Excel for data analysis or have a passing familiarity with any other BI tool, even at a high level, you’ll find yourself more comfortable. The course moves quickly, so coming in with a mindset ready to absorb new technical information is more important than specific prior Spotfire experience. Essentially, bring your analytical thinking cap and a desire to turn raw data into actionable insights.
Skills & Tools
Upon completing this course, you'll be well-versed in leveraging TIBCO Spotfire across its various interfaces (desktop, web, and Cloud). You'll master the art of connecting to diverse data sources, from traditional databases to cloud-based platforms, and crucially, understand how to craft efficient data models using relationships, unions, and joins. The course meticulously covers all the core chart types – Cross Tables, Bar Charts, Line Graphs, Geo Maps, Heat Maps, Scatter Plots, Summary Tables – and more, emphasizing their optimal application and configuration for compelling storytelling. Beyond visualization, you'll gain expertise in creating highly interactive dashboards with various property controls like dropdowns and sliders. For the truly ambitious, the curriculum delves into integrating external scripting languages like Python and R, and even developing custom visualizations using Spotfire Mods, truly elevating your development prowess.
Career Benefits & Job Roles
In today's data-driven world, proficiency with industry-standard tools like TIBCO Spotfire translates directly into significant career growth opportunities. This course equips you with tangible, job-ready skills highly sought after by organizations that rely on advanced analytics. Graduates can confidently step into roles such as a BI Developer, Data Analyst, Business Intelligence Engineer, or even a specialized Spotfire Developer. The skills learned here are also incredibly valuable for existing data scientists or business analysts looking to enhance their visualization and dashboarding capabilities. Furthermore, the comprehensive nature of the content can serve as an excellent foundation for any potential certification prep related to TIBCO Spotfire, bolstering your professional credentials and marketability.
Pros
- Comprehensive & Depth: The course truly lives up to its "Beginners To Advanced" billing, covering fundamental concepts all the way to intricate Python/R integration and Spotfire Mods. It doesn't shy away from complex topics, providing a thorough understanding.
- Hands-On & Practical: Abundant hands-on labs and live examples ensure that theoretical knowledge is immediately put into practice. This practical approach is vital for developing genuine proficiency and confidence.
- Advanced Topics Inclusion: The curriculum's embrace of scripting (Python/R) and custom development (Mods) is a major differentiator, setting you up for advanced customization and complex real-world projects that many other courses might omit.
- Focus on Interactivity & Design: Beyond just building charts, the emphasis on creating "Interactive and Beautiful Dashboards" with property controls and filters teaches crucial design principles for effective data communication, a key job-ready skill.
Cons
- Pacing for Absolute Beginners: While thorough, the "fast-paced" nature, especially when transitioning to more advanced concepts like Python/R scripting and Mods, might require absolute beginners without any prior data analysis or programming exposure to invest significant extra time in self-practice and research to keep up. It's comprehensive, but not necessarily slow-paced for those completely new to the BI world.