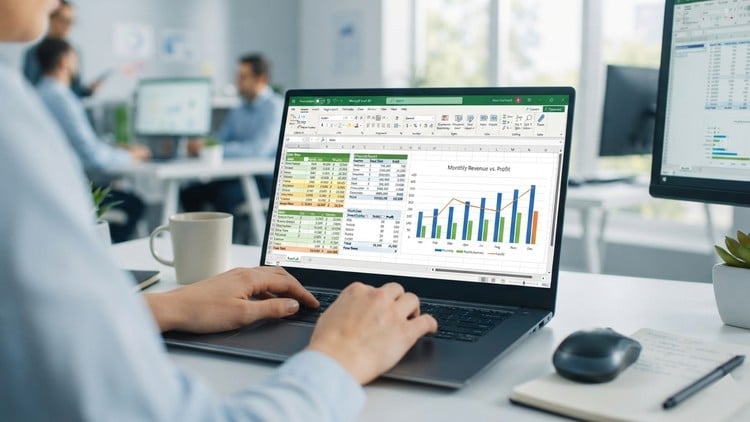
Step-by-step Microsoft Excel course covering formulas, Pivot Tables, & charts
What You Will Learn:
- Master Basic Excel Functions and Formulas: Learn essential Excel functions like SUM, AVERAGE, VLOOKUP, and IF statements for efficient data analysis.
- Get proficient at navigating and customizing the Excel Ribbon and shortcuts to enhance productivity and streamline your workflow.
- Explore PivotTables, PivotCharts, and conditional formatting to analyze data and create dynamic, insightful visualizations.
- Automate repetitive tasks using Excel Macros and VBA, saving time and increasing efficiency with custom solutions.
The Reality Check: Why This Isn’t Just Another Spreadsheet Course
Let’s be honest for a second. We’ve all seen those resumes where people claim to be “proficient in Microsoft Office,” yet they struggle to sum a column without using their fingers. In my fifteen years in the tech industry, I’ve realized that Excel is the “cockroach” of software—it simply will not die, and it remains the backbone of global business. If you aren’t comfortable with it, you’re basically working with one hand tied behind your back. I recently went through the Microsoft Excel for Beginners course, and I wanted to give you my unfiltered take on whether it actually delivers job-ready skills or if it’s just more digital noise.
Most “beginner” courses spend three hours explaining how to change a font. This course, thankfully, respects your time. It bypasses the fluff and dives straight into the mental framework of data management. What I appreciated most was the focus on logic. Instead of just memorizing where buttons are, the curriculum forces you to think like a data analyst. It bridges the gap from beginner to advanced by showing you not just *how* to use a VLOOKUP, but *why* it’s the superior choice for relational data over manual searching. It’s about building a foundation that supports career growth rather than just ticking a box on a certification prep checklist.
What You Need Before You Start
- A Working Copy of Microsoft Excel: Ideally the Office 365 version, though 2019 or later will get you through 95% of the material.
- Basic PC Literacy: You should know how to save files, navigate folders, and use a mouse without thinking about it.
- Zero Ego: You might think you know Excel, but be prepared to realize you’ve been doing things the “hard way” for years.
- Analytical Patience: Some of the hands-on labs require you to troubleshoot your own typos in formulas, which is where the real learning happens.
The Toolkit: Skills & Industry-Standard Tools
This course packs a punch when it comes to industry-standard tools. You aren’t just looking at grids; you’re learning to manipulate the very environment of the software. The syllabus covers the essential “big three” of Excel—Functions, Data Visualization, and Automation. Specifically, you’ll master:
- Advanced Lookup Functions: Moving beyond basic arithmetic into VLOOKUP and IF statements to handle complex data sets.
- Dynamic Data Visualization: Using PivotTables and PivotCharts to turn a wall of numbers into a story that a manager can actually understand.
- The Ribbon & Workflow Hacks: Customizing your workspace and learning keyboard shortcuts that make you look like a wizard during screen-share meetings.
- Introductory Automation: A solid primer on Excel Macros and VBA, which is the gateway drug to full-scale programming and custom solutions.
Career Benefits & Job Roles
If you’re looking for job-ready skills, this is the gold standard. In the current market, “data literacy” is a requirement, not a bonus. Completing this course and working through the real-world projects prepares you for a variety of high-demand roles. Whether you are aiming for a position as a Data Analyst, Financial Planner, Project Manager, or even an Operations Lead, the ability to build a self-sorting dashboard is a massive competitive advantage. This isn’t just about spreadsheets; it’s about career growth. Employers want people who can solve problems, and a properly structured Excel workbook is a problem-solving machine.
Why I Actually Liked It (The Pros)
- Practical Hands-on Labs: The course doesn’t just lecture at you. The hands-on labs are based on real-world projects, like budget tracking and sales forecasting, which means you leave with templates you can actually use at work tomorrow.
- No-Nonsense Pace: It moves quickly. Once you master the basics of the Excel Ribbon, it pushes you into conditional formatting and data logic, keeping the engagement high for those who find traditional learning boring.
- Future-Proofing with VBA: Most beginner courses skip Macros and VBA entirely. Including this gives students a massive leg up and acts as excellent certification prep for higher-level Microsoft exams.
The Honest Truth (The Con)
If I have one gripe, it’s that the VBA and Macros section feels a bit like a “teaser.” While it’s great for getting your feet wet, VBA is a deep rabbit hole. Beginners might find the jump from PivotTables to writing custom solutions in code a bit jarring without more bridge material. It’s an incredibly powerful tool, but be prepared to do some extra outside reading if you really want to master the automation side of things.
Overall? It’s a solid investment for anyone serious about their professional toolkit. Stop “clicking around” and start actually using the software.