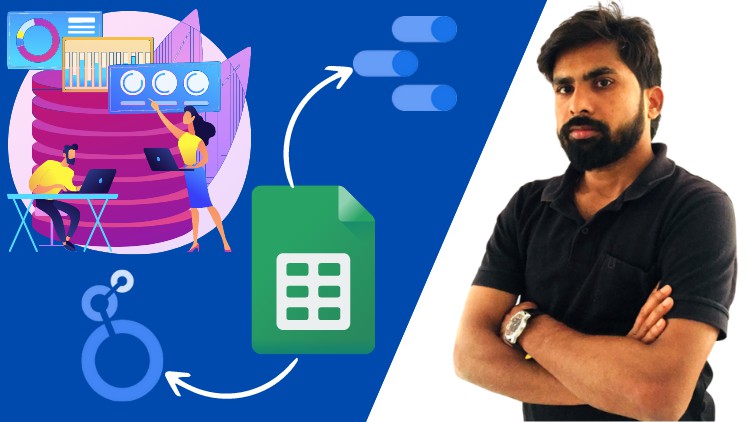
Learn how to create POWERFUL data analysis and dashboards with Google Data Studio | Looker Studio for your Google Sheets
What you will learn
Create POWERFUL Interactive Dashboards from Google Sheets Data in Minutes
Create powerful SCORECARDS displaying Actual Numbers
Learn powerful VISUALIZATIONS such as Pie, Column, Bar, Charts in Hindi
Create TIME SERIES graphs that easily display Month to Date, Previous Month and many more
Create FILTERS to easily create interactive dashboards, graphs and reports
Learn from an Instructor with over 4 years teaching Google Workspace | Data Studio and Taking Training
Description
In this Course I will teach you Looker Studio formerly known as Google Data Studio from scratch to Intermediate Level.
- Class Overview: How to prepare Dashboards from basics and Automate Reports in Looker Studio
- What You Will Learn: Data Preparation, Connecting different data sources to Dashboard, Create Different types of Charts adding Styles, Data Blending Ideas, Trouble shootings and many more.
- Why You Should Take This Class: I have explained in very easy and simple Hindi Language with examples and Ideas:
- Looker Studio is one of Best Tool for Dashboard preparation where you can connect multiple types of Data sources and create a professional Dashboard.
- With this Skills you can enhance your skills to get more chances to attract good opportunities.
- I have more than 12+ years of extensive experience in various industries and domains as I have been imparting trainings on Google Data Studio, Sheets, Slides, Docs, Google Workspace (Gsuite) for last 4+ years.
- Who This Class is For: Working Professionals, Students, Job Seekers, MIS Executives, DMEs, Data Analyst, etc.
- Materials/Resources: Practice Sheet and Actual Dashboard Links are available to create your First Reports Easy.
Report you have to create using the sample data or you can also connect your data to prepare the report and practice.
In order to complete the project please follow the below instructions:
Sample Data:
- Download Excel file and upload it to Google Drive
- Convert it to Google Sheets OR
- Open this file : Google Sheet | Practice File
- Make a Copy of it
Getting started with Looker Studio
- Connect the above data to Looker Studio
- make necessary changes if required any
- create your first report with the Video Sequences
- refer the Existing Dashboard
Also adding the Report reference file as PDF and Excel which was used in the lesson.
Sharing Your Work:
Share your final report in PDF Format with the class by uploading to the “Create Project” section. If you have any questions or need more tips, please let me know! I’m happy to help!
Content
Introduction