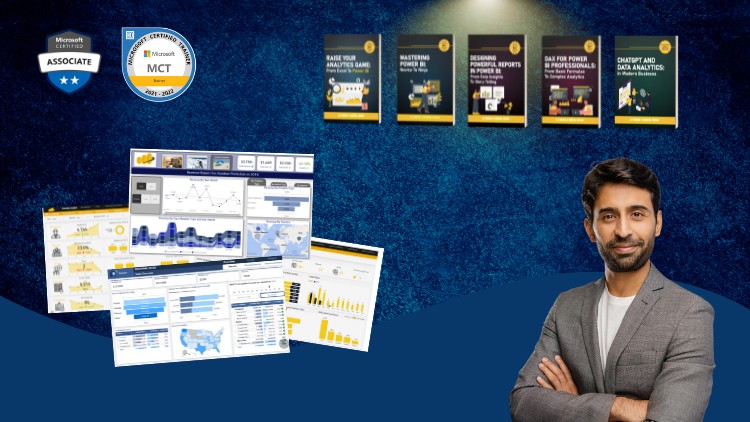
A Full Guide to Creating Insightful Reports, Interactive Dashboards, and Effective Data Storytelling Using Power BI
What you will learn
Note➛ Make sure your 𝐔𝐝𝐞𝐦𝐲 cart has only this course you're going to enroll it now, Remove all other courses from the 𝐔𝐝𝐞𝐦𝐲 cart before Enrolling!
Design professional-quality reports in Power BI that are both visually appealing and easy to navigate.
Create interactive dashboards that allow users to explore data and gain insights dynamically.
Explore advanced Power BI features such as bookmarks, drill-throughs, and report tooltips to enhance report interactivity.
Implement themes and templates to ensure consistency across reports and align with organizational branding.
Use Power BI’s various visualization options to represent data effectively, including charts, maps, and custom visuals.
Become an expert in using Power BI to analyze and visualize numbers
English
language